Introduction: Why Analyzing Air Quality Matters
Take a deep breath… Ah, that feels good, right? But what if every breath you took wasn’t quite so refreshing? Unfortunately, that’s the reality for many city dwellers around the world. Air pollution is a growing problem, and its impact on our health is undeniable.
But fear not! I recently dug into the data on pollutants like PM2.5, PM10, carbon monoxide, ozone, and nitrogen dioxide, all of which can have serious health consequences. Using the power of Excel for data analysis, I examined the air quality right here in our own city. So, buckle up and get ready to dive into the findings! This blog is all about raising awareness, understanding the data, and most importantly, taking action to ensure we’re all breathing easier.
Unveiling the Invisible: Analyzing Your City’s Air Quality Data
Ever wondered what you’re breathing in every day? Clean air is essential for a healthy life, but in bustling cities, pollution can lurk unseen. To shed light on this invisible threat, we decided to delve into the air quality data for our very own city!
Using a treasure trove of information from Kaggle, a platform brimming with public datasets, we focused on five key culprits that can impact our health:
- PM2.5 and PM10: These tiny particles, less than 2.5 and 10 micrometers in size respectively, can infiltrate deep into our lungs, causing respiratory problems and even heart disease.
- Carbon Monoxide (CO): This odorless gas disrupts the oxygen flow in our blood, leading to headaches, dizziness, and fatigue.
- Ozone (O3): This gas might sound familiar from the ozone layer protecting us from the sun, but at ground level, it irritates the lungs and triggers respiratory issues.
- Nitrogen Dioxide (NO2): Emitted from car exhaust and industrial processes, NO2 can aggravate asthma and contribute to respiratory illnesses.
By analyzing these pollutants using data analysis techniques, we can gain valuable insights into the air we breathe and take action toward a healthier future for ourselves and our city. So, stay tuned as we explore the data and uncover the air quality story!
Data Analysis of PM2.5 Levels in Major US Cities
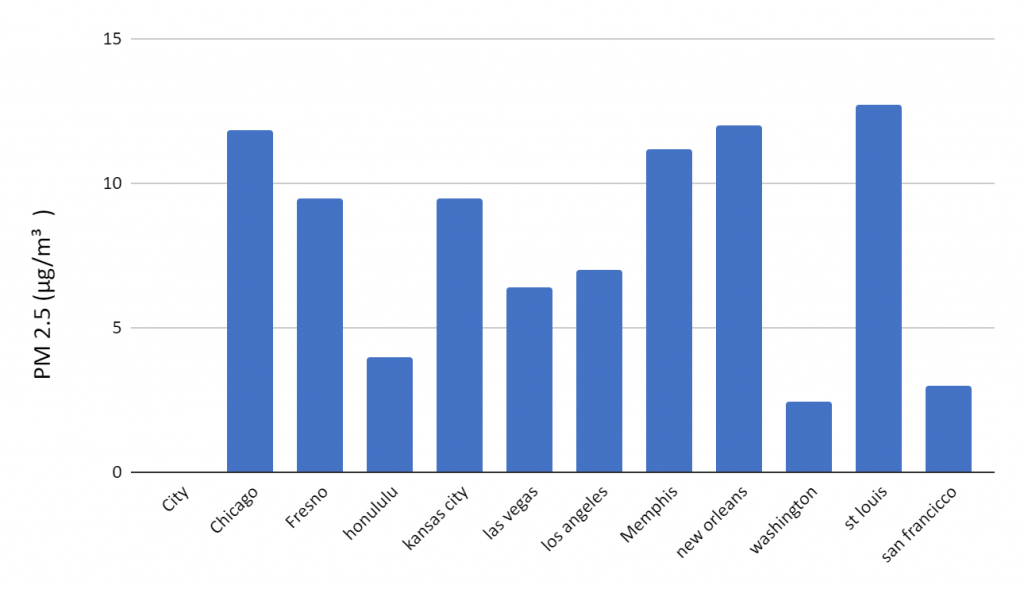
Ever wonder how your city stacks up in the air quality department? We took a deep dive into PM2.5 levels, a major air pollutant, across ten bustling US cities: Chicago, Fresno, Honolulu, Kansas City, Las Vegas, Los Angeles, Memphis, New Orleans, Washington D.C., and San Francisco.
PM2.5, those microscopic particles less than 2.5 micrometers in size, can wreak havoc on our lungs, causing respiratory problems and even heart disease. So, how did these cities fare?

The graph below displays the levels of PM2.5 (particulate matter with a diameter of 2.5 micrometers or less) in various cities across the United States. PM2.5 particles are small enough to be inhaled deeply into the lungs, posing risks to respiratory and cardiovascular health.
Based on the reference value (around 12 micrograms per cubic meter), some observations can be made:
- The cities of Chicago, Fresno, and Honolulu have PM2.5 levels exceeding the reference value, indicating potentially higher air pollution levels.
- Several cities, including Indianapolis, Memphis, Raleigh-Durham, Winston-Salem, and San Francisco, have PM2.5 concentrations below the reference value, suggesting relatively better air quality.
- Los Angeles and Nashville are close to the reference line, implying their PM2.5 levels might be near the recommended guideline.
It’s important to note that the specific reference value can vary based on the guidelines or standards set by relevant authorities, such as the Environmental Protection Agency (EPA) or the World Health Organization (WHO). Lower PM2.5 levels are generally considered more desirable for public health and environmental reasons.
Analyzing PM10 Levels in Major US Cities
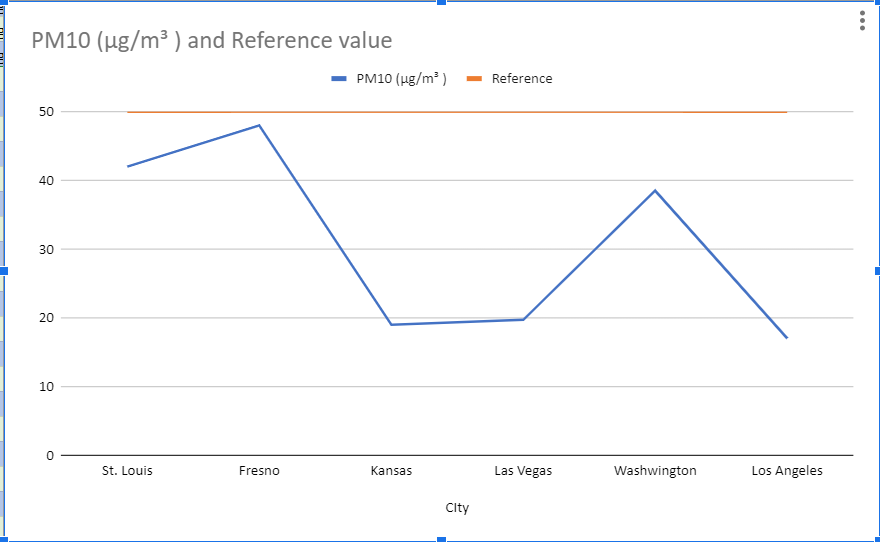
The graph below illustrates the PM10 (particulate matter with a diameter of 10 micrometers or less) levels in different cities across the United States. PM10 particles can penetrate deep into the respiratory system and contribute to various health issues, including respiratory and cardiovascular problems.

Based on the information provided in the graph, we can make the following observations:
- Louis has the highest PM10 level among the cities shown, significantly exceeding the reference value (likely a recommended guideline or standard).
- Fresno and Kansas City also exhibit elevated PM10 concentrations, though lower than St. Louis.
- Las Vegas has a PM10 level around the reference value, indicating a moderate level of particulate matter pollution.
- Washington and Los Angeles have relatively lower PM10 levels compared to the other cities displayed.
PM10 particles can originate from various sources, such as construction activities, industrial emissions, vehicular traffic, and natural sources like dust storms. The specific sources and contributing factors may vary across different cities, influencing the observed PM10 levels.
Monitoring and controlling PM10 levels is crucial for public health, as prolonged exposure to these particulates can exacerbate respiratory conditions like asthma, lead to lung irritation, and increase the risk of cardiovascular diseases. Cities with higher PM10 concentrations may need to implement stricter emission control measures and air quality management strategies to mitigate potential health impacts on their residents.
Actionable Steps for Students to Improve Air Quality
As students, you have a unique opportunity to be at the forefront of environmental change. By taking simple, effective actions, you can make a significant impact on the air quality in your community. Here are some ways you can contribute:
At Home and School: Personal Actions
- Ride Smart: Walk, bike, or use public transportation to get to school instead of being driven in a car. If you must drive, consider carpooling with friends to reduce the number of vehicles on the road.
- Energy Savers: Turn off lights, computers, and other electronics when they’re not in use. Use energy-efficient bulbs and appliances to reduce your carbon footprint.
- Get Green: Participate in planting trees and caring for gardens at school or in your neighborhood. Plants naturally filter the air and improve its quality.
- Reduce, Reuse, Recycle: Be mindful of waste. Recycle paper, plastic, and other materials. Reducing waste can lower the pollution associated with manufacturing and disposal.
- Avoid Pollutants: Choose non-toxic, eco-friendly products for school projects and household cleaning. Avoid using aerosol sprays and other items that release harmful chemicals into the air.
At School: Collaborative Efforts
- Green Initiatives: Start or join an environmental club at school. Work on projects like recycling drives, clean-up events, and tree planting.
- Awareness Campaigns: Organize campaigns to educate fellow students about air pollution and what they can do to help. Use posters, social media, and school announcements to spread the word.
- Clean Air Days: Propose a “No Car Day” at school where students and staff are encouraged to walk, bike, or use public transport. Highlight the benefits through fun events and activities.
- Energy Audits: Conduct an energy audit of your school to identify ways to save energy. Present your findings to school administrators and suggest practical changes.
In the Community: Making a Broader Impact
- Community Involvement: Participate in local environmental clean-up events and tree planting initiatives. Invite friends and family to join you.
- Advocate for Change: Write letters to local government officials or start petitions advocating for better air quality policies and practices in your community.
- Support Green Projects: Encourage your school and community to adopt renewable energy sources, like solar panels, and support local green businesses.
- Stay Informed: Keep up with the latest news and research on air quality and environmental issues. Share what you learn with others to raise awareness.
Leading by Example: Inspiring Others
- Be a Role Model: Show your peers and community that making eco-friendly choices is both easy and important. Your actions can inspire others to follow suit.
- Use Your Voice: Speak up about the importance of clean air. Whether it’s through presentations, social media, or school projects, let your voice be heard.
- Innovate: Think creatively about new ways to improve air quality. Whether it’s through science projects, technology, or art, your ideas can make a difference.
By taking these steps, students can play a pivotal role in improving air quality. Every small action adds up, and together, we can make a big difference. Let’s work towards a future where everyone can breathe cleaner, fresher air. Your efforts today will pave the way for a healthier tomorrow.
Citizen Science: Be the Eyes (and Sensors) in the Sky!
We’ve analyzed the data, but what if you could be part of the solution? Citizen science initiatives are revolutionizing air quality monitoring by empowering everyday people like you and me!
Imagine a network of sensors, not just at government stations, but on balconies, bikes, and backpacks across the city. This is the power of citizen science! These initiatives provide low-cost air quality sensors and user-friendly apps, allowing you to collect valuable real-time data on pollutants like PM2.5.
Here’s how citizen science makes a difference:
- Hyperlocal Data: Official monitoring stations can miss crucial variations in air quality across different neighborhoods. Citizen science fills these gaps, providing a more comprehensive picture.
- Empowerment and Awareness: By actively participating, you gain a deeper understanding of your city’s air quality and the factors that influence it.
- Crowdsourced Advocacy: The more data we collect, the stronger the case for cleaner air policies and initiatives.
Citizen science isn’t just about collecting data; it’s about creating a community of informed citizens who can advocate for a healthier future. So, are you ready to become a citizen scientist and breathe a little easier with the knowledge that you’re making a difference?
Conclusion: Taking Action for a Healthier Future
Understanding and analyzing air quality data is the first step towards a healthier environment. In online coding classes for kids at SkoolOfCode, we empower our students to tackle real-world issues through hands-on projects. Guided by our dedicated teachers, students like Vivaan use coding and data analysis to create impactful solutions and raise awareness about pollution.
Our approach ensures students are equipped to understand complex problems and propose practical actions. By promoting eco-friendly practices and participating in citizen science initiatives, SkoolOfCode fosters a generation of proactive, environmentally conscious individuals.
Together, we advocate for cleaner air and stricter standards, aiming for a future where every breath is a breath of fresh air. Join us at SkoolOfCode as we educate, innovate, and inspire action for a healthier planet. Your efforts today will pave the way for a better tomorrow.
